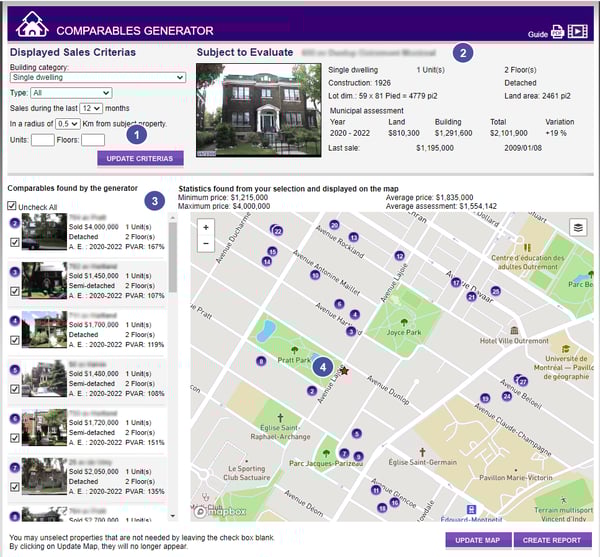
1. Once your are directed in the Comparables Generator, properties similar to your subject are automatically defined by the tool. You can modify these criteria if needed and then click Update Criteria
- Building category (optional means all categories);
- Type (depending on the building category);
- Sales period, from 1 to 24 months;
- Radius of 500 meters to 10 miles around the property.
2 .The subject to evaluate was defined previously and can not be changed. The general information is presented (type, number of units and floors, year of construction, lot dimension and land area,municipal assessments, amount and date of the last sale).
3. Comparables found by the generator are indicated with the basic information and a photo of the property (if available). Use the scroll bar to go down the list.
4. The number written beside the property refers to its location on the map. The red star locates the evaluated property.
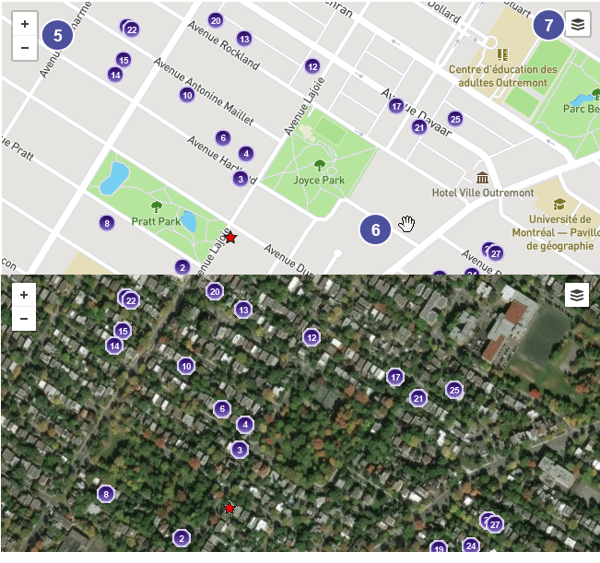
5. You can click + or - to zoom in or out of the map.
6. Move around the map by using the hand.
7. Click on the icon located at the top right of the map to view in satellite mode or to return to street mode.
8.You can remove from the list the properties that you think are not a good comparable because the sale price is too low or because some specifications of the property are different. Uncheck these properties and click Update Map. These properties won’t appear in the printed report.
Tip : We suggest that you keep a minimum of 4 comparables if you want your report to be significant.
9. The PVAR acronym refers to the ratio of the selling price versus the assessment roll ( at the time of the transaction). Thus, when it is above 100%, the selling price is above the assessment. For example, a $300,000 sale price on a property valued at $200,000 would give a 150% PVAR (300/200).
10. Once all comparables are selected, click on Update Map.
11. The statistics of comparables on the map will adjust according to the properties you remove from the list. Thus, the minimum and maximum price represent the lowest and higher amounts of your selected properties. The average price displayed is the one of your selected properties. Finally, you can see the average assessment of your selected comparables.
12. To print or save the report in PDF, click on Create Report. You report with representative comparables will then be automatically created.
