Once you are in the Real Estate Radar, you have access to the statistics of the transactions of single dwellings and/or condominiums in Quebec within the last month.
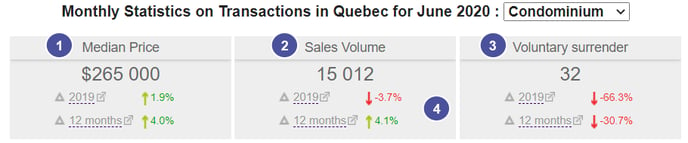
1. The median price is indicated. This price allows you to divide in two the series of monthly statistics of the single dwelling transactions. This means that approximately 50% of the sales have been done at a higher price and 50% at a lower price. We prefer the median price to the average price becauseit is not influenced by extreme values.
2. The number of sales is indicated.
3. The number of repossessions is indicated.
4. A variation is calculated regarding the same period. The variation is between the past 12 months (or four quarters) and the previous 12 months (or four quarters). This variation is in percentage. The green colour indicates that the data has increased while the red colour indicates that the data has dropped.
5. At the bottom of the page, you also have access to some definition of terms you will come accross while navigating in the tool.
To learn more about the Real Estate Radar, read this article.