The Real Estate Radar is an interactive statistics tool that helps you get information about sales, bad debts and the sociodemographic profile of a borough according to its territory and its building type. This tool is offering you a precise vision of the real estate market adapted to your needs.
Charactristics of the Real Estate Radar
How to access the Real Estate Radar
How to perform a search and navigate through the Real Estate Radar
Characteristics of the Real Estate Radar
- Select a district :
- Province (Quebec);
- CMA (Census Metropolitan Areas);
- Administrative regions;
- CRM (Regional County Municipality) (available on the complete version of the Real Estate Radar);
- City and districts (available on the complete version of the Real Estate Radar).
- Select a type of building
- Single-family home;
- Condo;
- Properties with 2 to 5-unit;
- 6 unit and more (available on the complete version of the Real Estate Radar);
- Industrial, commercial and institutional buildings (available on the complete Real Estate Radar
- Select a period between a month, a trimester and a semester. Data will be available a few daysafter the ending of the period.
- View all statistics of real estate sales:
- Sales volume and median price;
- Distribution of sold properties;
- Breakdown of sales by value.
- Analyze the volume of Bad Debts:
- Prior Notices, Surrenders and Legal Hypothecs;
- Breakdown by categories of buildings.
- Get a sociodemographic portrait :
- Population, surface (square kilometers) and median wage;
- The distribution of the properties in the sector;
- The year of construction of the properties;
- The languages talked in the district and the age of the population.
How to access the Real Estate Radar?
There are two ways you can access the Real Estate Radar.
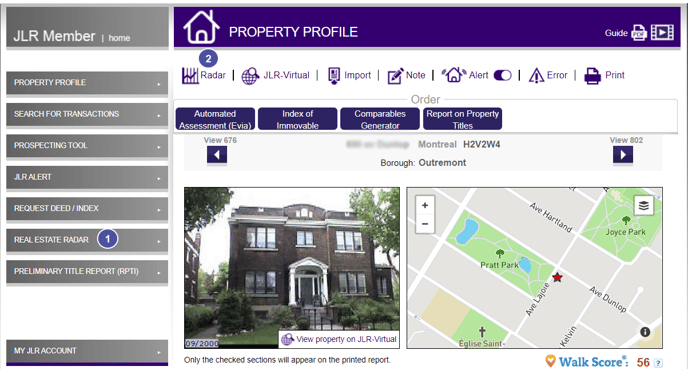
Option 1: Once you're in your JLR account, click on Real Estate Radar in the left menu.
Option 2: Once you are in a property profile, click on the Radar tab at the top of the profile
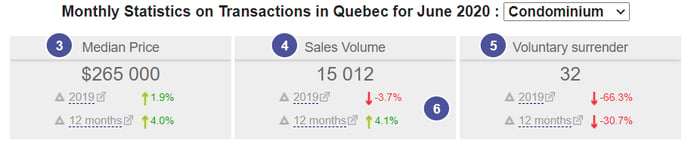
Once you are in the Real Estate Radar, you have access to the statistics of the transactions of single dwellings and/or condominiums in Quebec within the last month.
3. The median price is indicated. This price allows you to divide in two the series of monthly statistics of the single dwelling transactions. This means that approximately 50% of the sales have been done at a higher price and 50% at a lower price. We prefer the median price to the average price becauseit is not influenced by extreme values.
4. The number of sales is indicated.
5. The number of repossessions is indicated.
6. A variation is calculated regarding the same period. The variation is between the past 12 months (or four quarters) and the previous 12 months (or four quarters). This variation is in percentage. The green colour indicates that the data has increased while the red colour indicates that the data has dropped.
7. At the end of the homepage of the Real Estate Radar tool, you will have all the details of the transactions, the legal advice and the rules of use and definitions.
How to perform a search and navigate through the Real Estate Radar
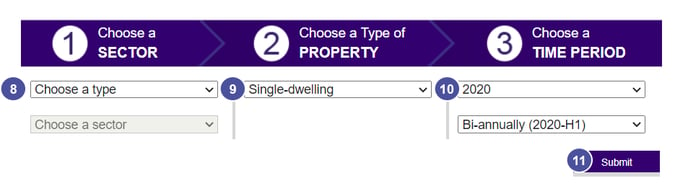
8. In the drop-down menu, choose a Sector.
a. Depending on the version of the Radar you're using (free version vs, paid version) , you can choose between the Province, CMA, Administrative Region, RCM, City-Borough
b. In the dropdownenu Choose a sector, you can specify your search, e.g. search for the Montreal CMA.
9. Choose a property type. Depending on your version of the Radar you can choose between Single-family homes, Condominiums, properties with 2 to 5-unit, properties with 6 units and more, IC&I and All.
10. Choose a time periode.
Note : when choosing the period you can go back 2009. For each year available, you can select a specific semester, trimester or month, depending on your needs
11. Click on Submit.
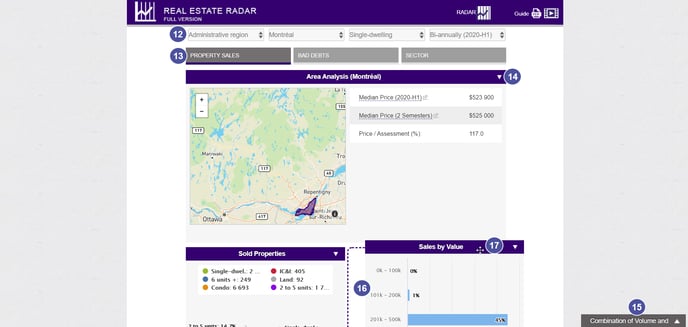
12. You can reset the criteria of your search at the top of the page in the Real Estate Radar tab.
13. To change the sector, click on the Property Sales tab, Bad Debts, or the Sector.
14. To delete graphics, click on the arrow at the right of the blue rectangles.
15. To put back a graphic that you deleted, click on the grey tab at the bottom of the page.
16. Inside a lot of graphics, you can click on the data to delete it from the chart and recalculate the values.
17. You can move the charts by clicking and sliding the blue rectangles of the graphic.